Real usage. Real context. Better decisions.

Turn usage
into decisions.

Understand how workstations, software and digital resources are really used — with context, precision and no invasive surveillance.

Product

A dashboard to read real usage.

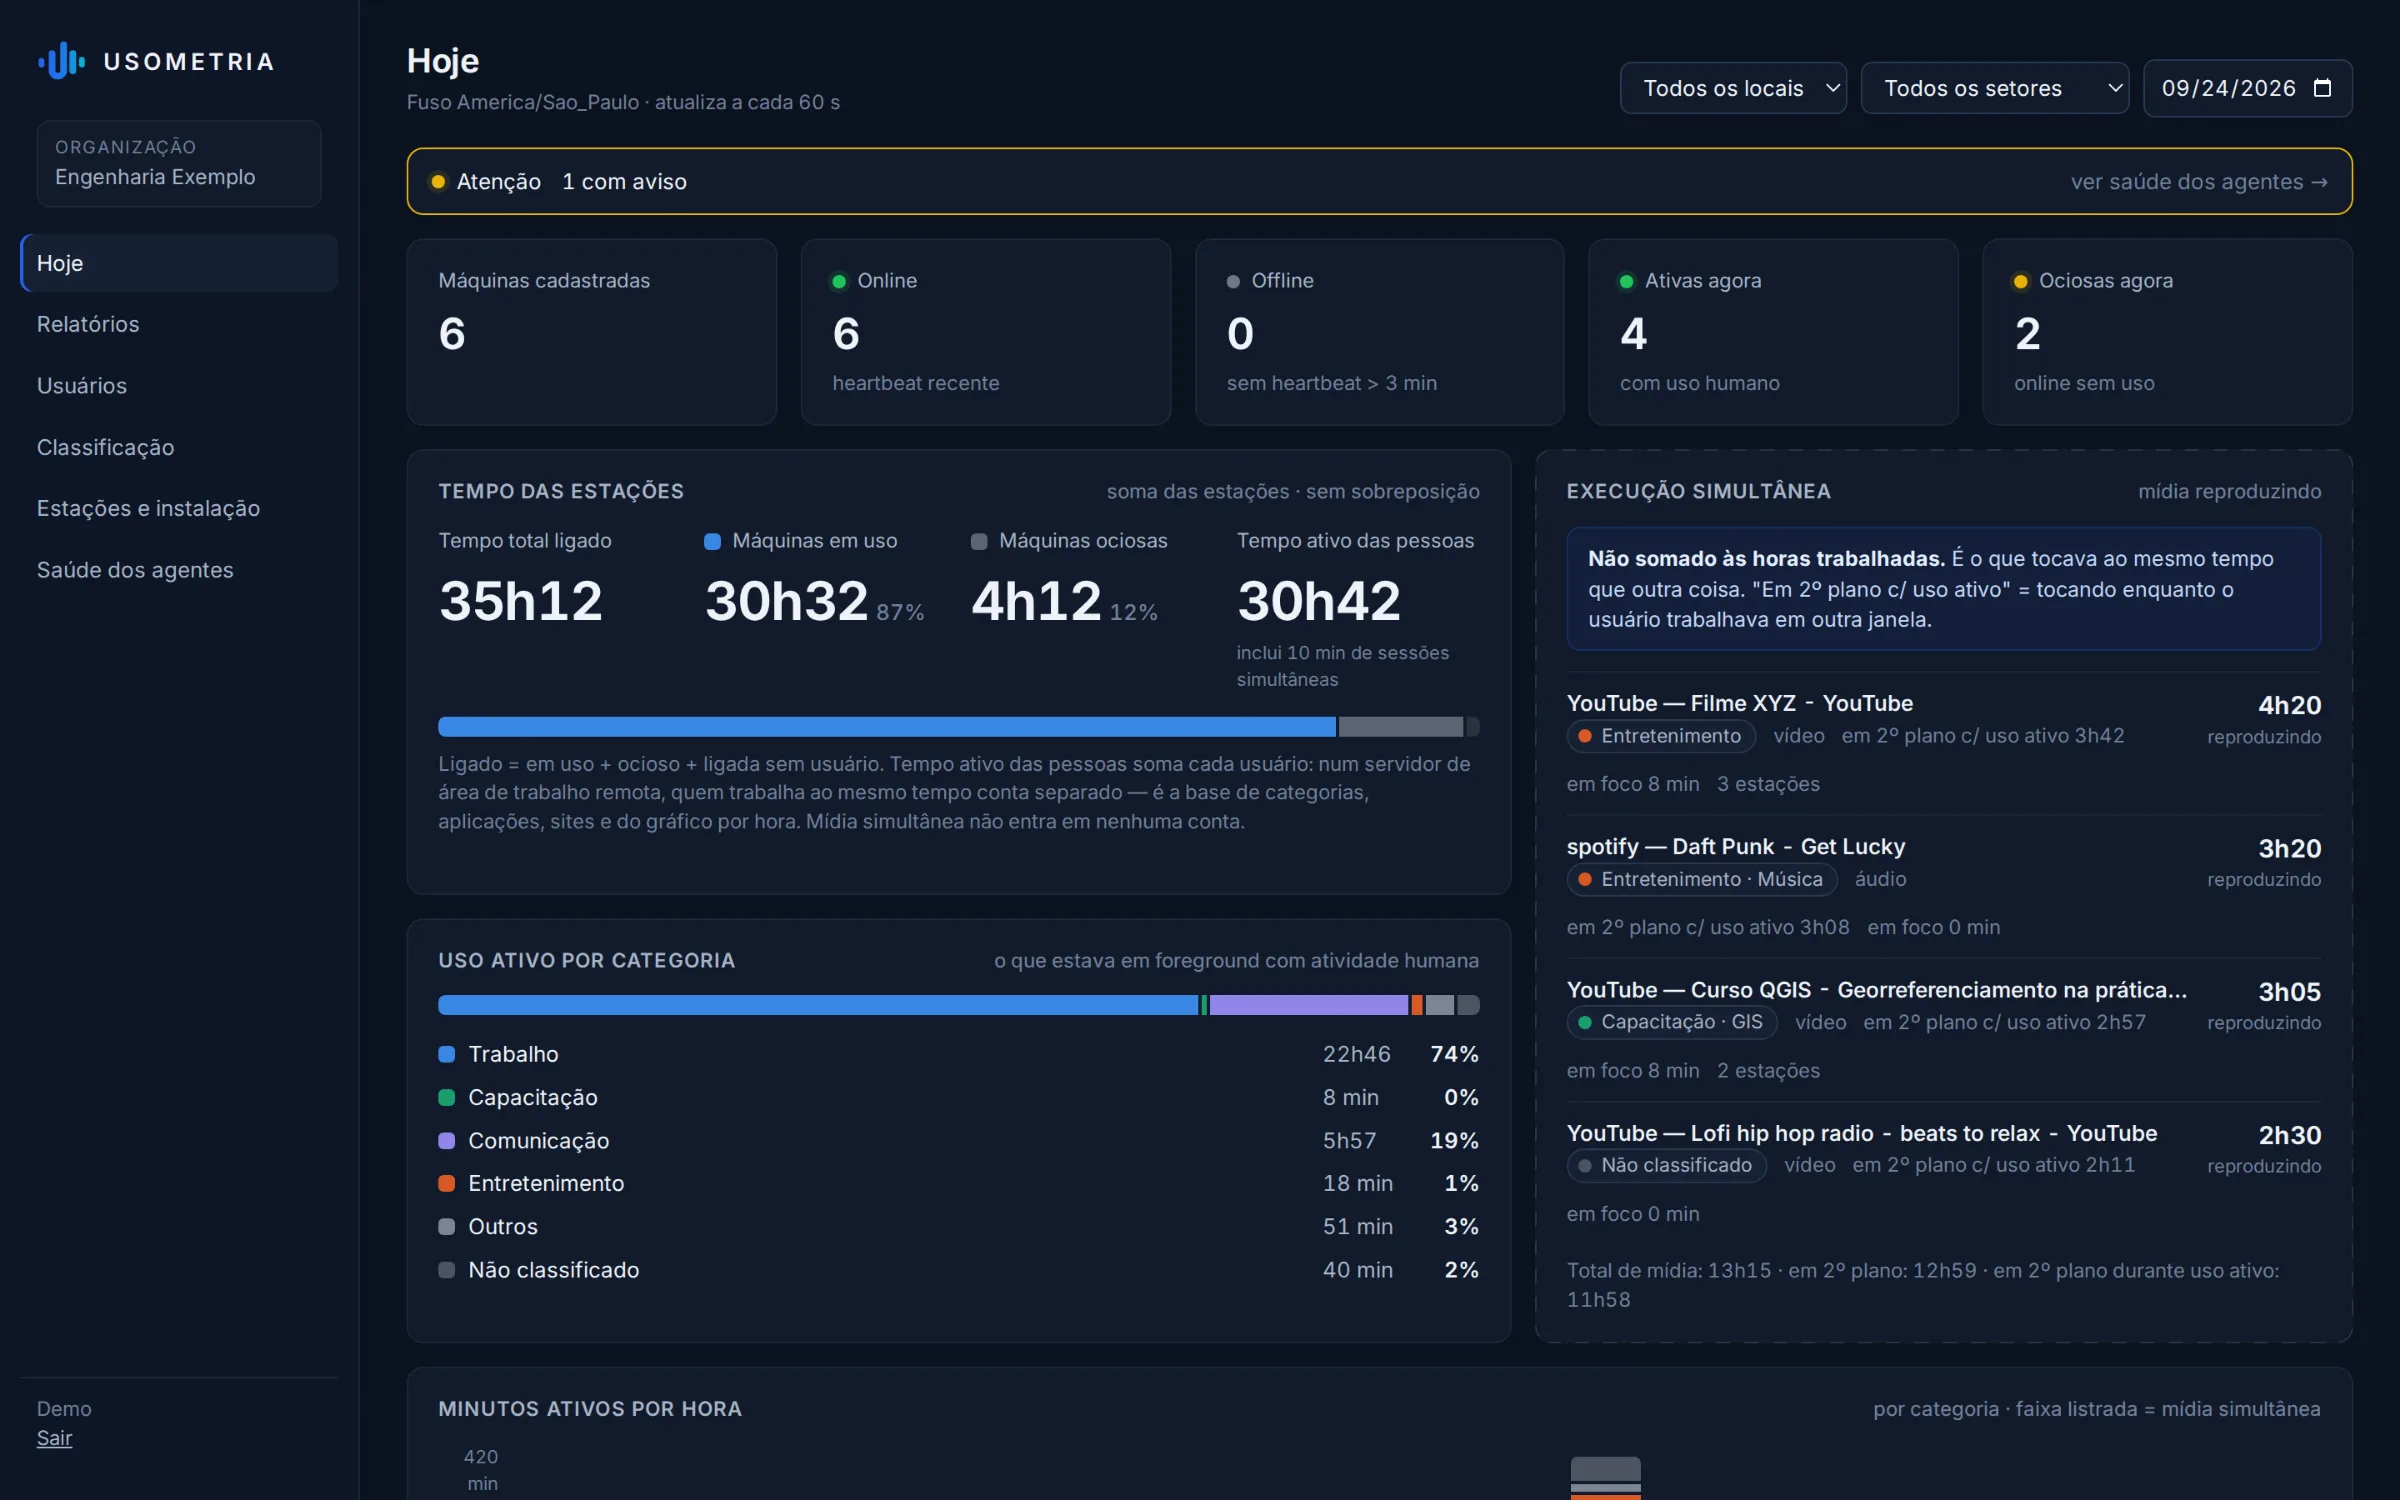
Workstation time, usage by context, applications, websites and simultaneous execution — in a single view, without adding up what happens at the same time.

Usometria Today screen (in Portuguese): workstation time on, in use and idle, active use by category, simultaneous execution, active minutes per hour, applications and websites.

Real Usometria screens, with demo data.

Do you know how much of your technology is actually used?

  • Workstationson × used
  • Softwareinstalled × used
  • Capacityavailable × idle

Companies know how many machines they own and which software they bought. They rarely know how much of those resources is actually used.

Which applications concentrate the work. Where idle capacity exists. Which tools were really adopted. How shared servers and remote access are used throughout the day.

Usometria answers with usage facts — not assumptions.

Workstations

A machine that is on is not a machine that is used.

On9h12
In use3h17
Idle5h55
00h08h12h17h1224h

Usometria tells apart time on, time actually used and idle periods. This lets you understand real capacity without confusing availability with usage.

Servers and remote access

People and machines have different clocks.

A remote desktop server may be in use for only a few hours while several people work on it at the same time.

Usometria separates machine time, people’s activity hours and simultaneous sessions — without multiplying the timeline and without hiding who worked.

Server3hin use
8 sessions18hof accumulated activity
0h1h303h
Illustrative example.

Classification

Context, not judgment.

  • Work
  • Training
  • Communication
  • Entertainment
  • Other
  • Unclassified

Usometria organizes usage by context. It does not automatically assign concepts such as “productive” or “unproductive”.

Data informs. The decision stays human.

Simultaneity

What happens at the same time matters too.

One application may be in use while another plays content in the background. Usometria distinguishes foreground, human activity, execution, simultaneous media and background — and never adds up what is simultaneous.

QGISmain activity YouTube in focus · 8 min 1h52 YouTubesimultaneous media 2h00 Chronological time2h00 14:0014:5016:00

Never 3h52. What plays at the same time is information, not worked hours.

Software

Find out which software is really used.

Which applications are used, by how many people, on which workstations, for how long and how often.

A basis for future capacity and licensing decisions — built from observed usage, not estimates.

Applications · last 30 days
ApplicationActive timeHoursPeopleWorkstations
QGIS184h1411
Excel126h1916
Teams97h2118
AutoCAD61h55
Acrobat22h99
Global Mapper3h11
Illustrative example, in the format of the Usometria applications report.

Data quality

Reliable data starts with collection.

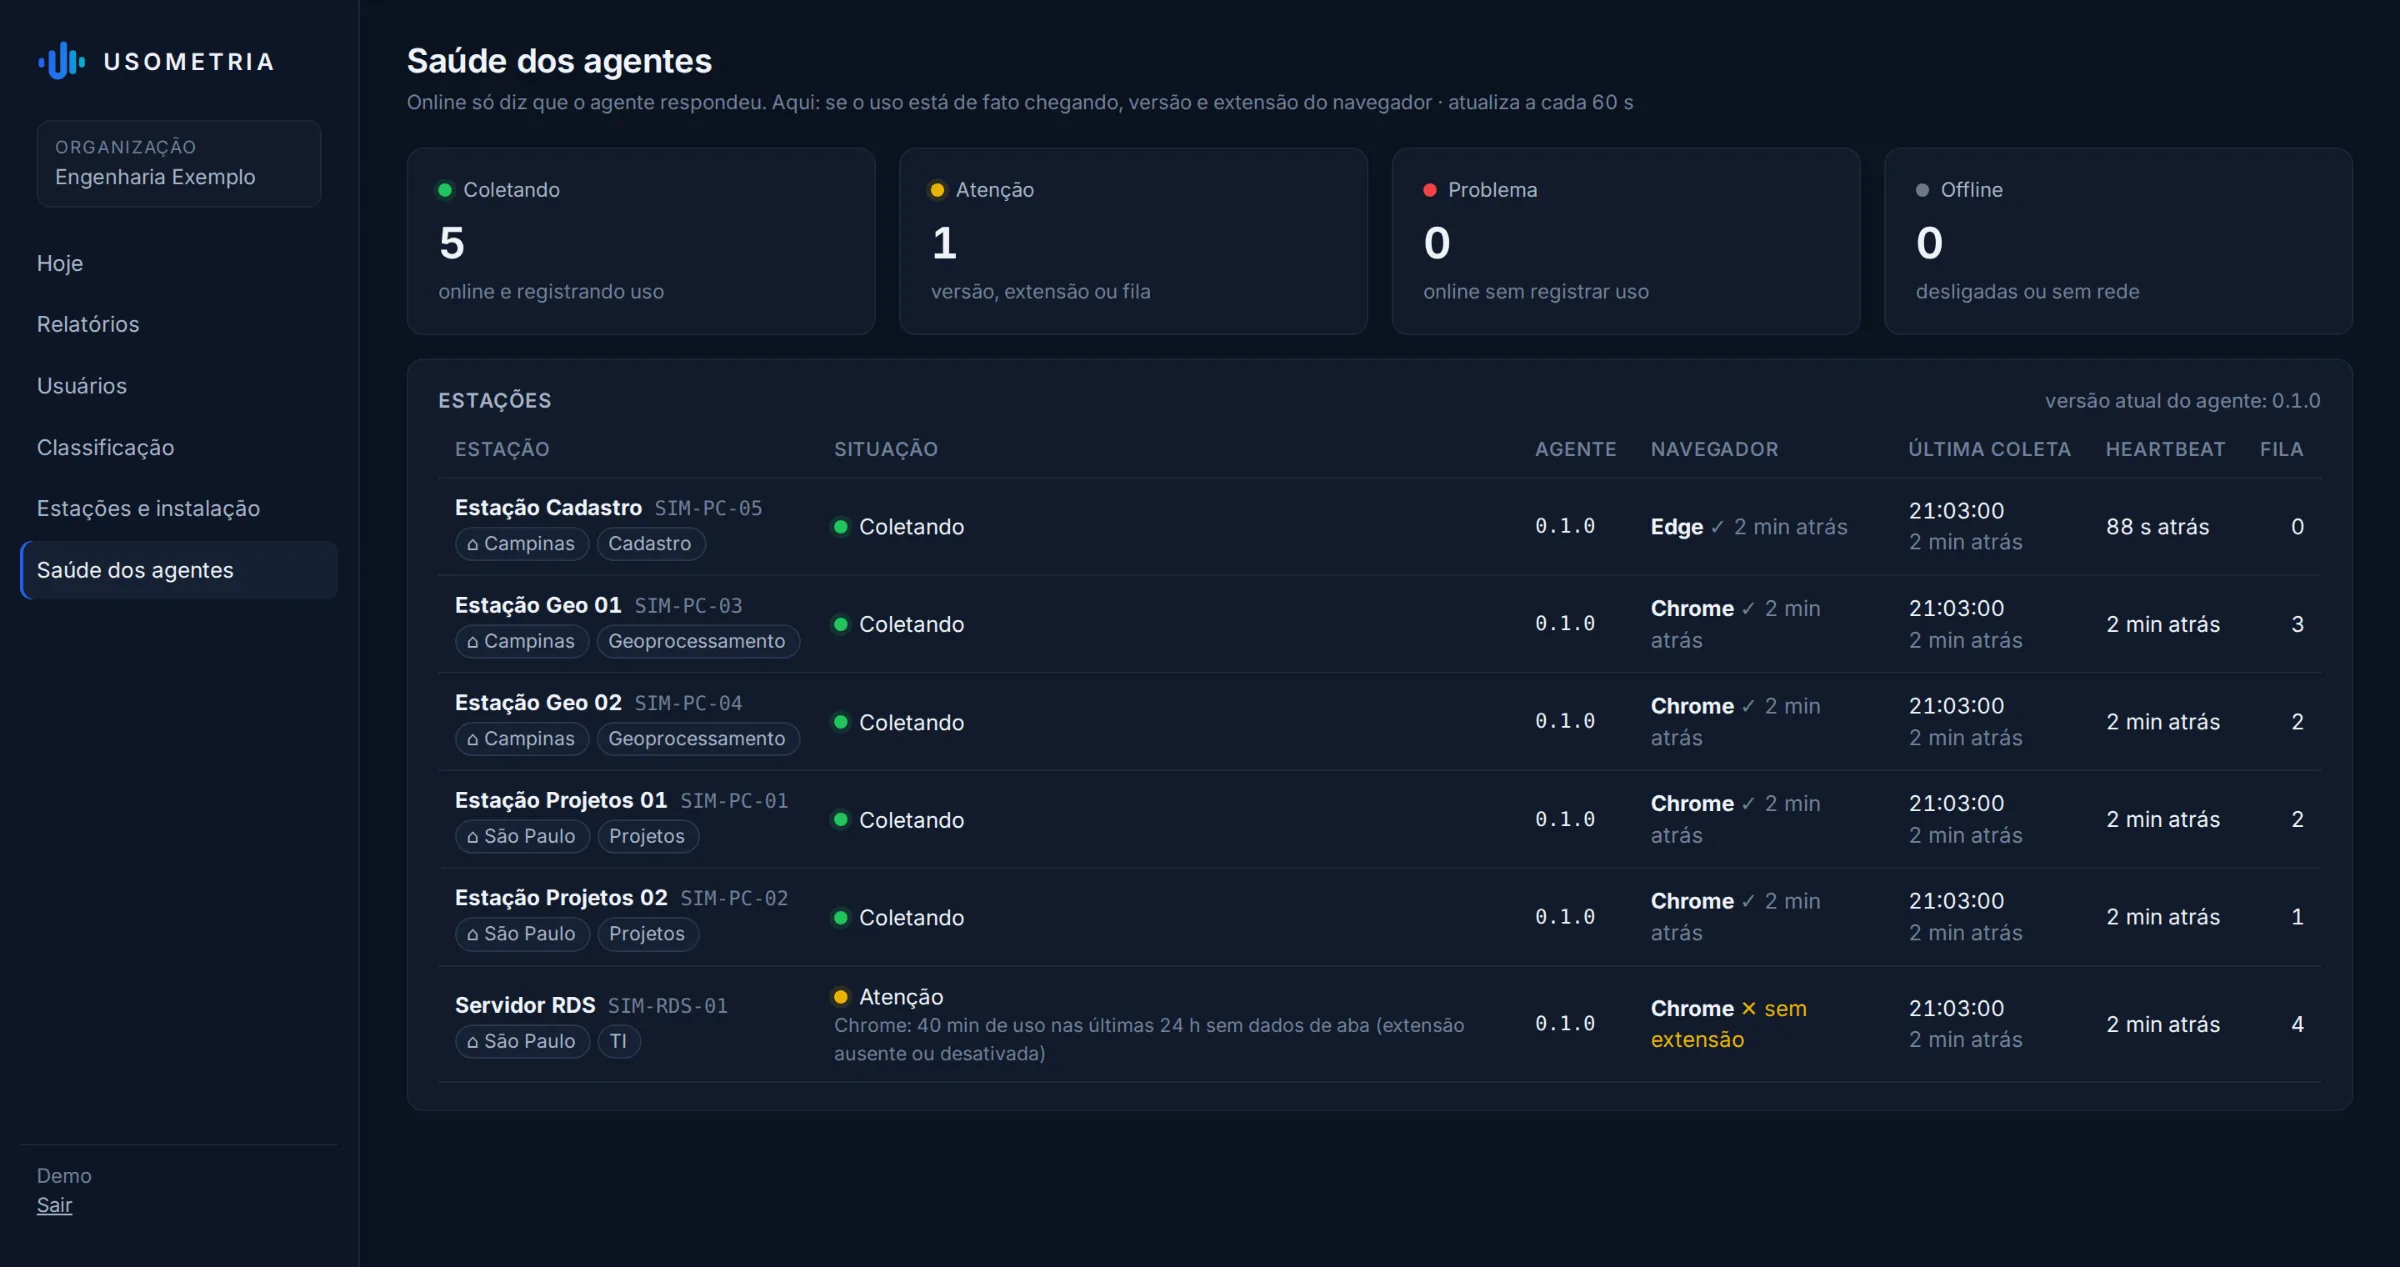
Being connected does not guarantee that usage is being recorded. The platform itself shows, workstation by workstation, whether collection is arriving, the agent version and the browser context coverage.

This way, missing information shows up as missing information — and does not turn into a conclusion.

  • Collecting
  • Attention
  • Problem
  • Offline
Agent health screen (in Portuguese): workstations collecting, one in attention for browser use without tab data, agent version, last collection and queue.

Privacy

Intelligence without invasive surveillance.

Usometria works with usage telemetry and technical context, following data minimization and transparency principles.

  • No keystroke logging
  • No password capture
  • No webcam
  • No microphone
  • No continuous screen recording

How it works

From usage to decision, in four steps.

  1. 01Install the agent.On Windows workstations and servers, with guided installation or through domain policy.Workstation
  2. 02Workstations send secure telemetry.Consolidated usage periods, over an encrypted connection.Telemetry
  3. 03Usometria organizes and adds context.Machine time, people time, categories and simultaneity.Usometria
  4. 04You turn usage into decisions.Dashboard and reports by site, department, workstation and period.Decision

Pricing

Simple pricing. Capacity that follows your environment.

You pay for monitored capacity — not for the volume of data collected.

Usometriamonitored capacity

R$149/month

Includes up to 5 monitored units

+ R$ 20/monthper additional unit
from the 6th to the 25th unit

  • Workstations and laptops
  • RDS / Terminal Server servers
  • Applications and web browsing
  • Simultaneity
  • Classification by context
  • Collection health
  • Reports
  • Managers and access profiles
Calculate my environment

Monthly plans. Annual terms on request.

  • No charge for event volume or monitored hours.
  • Management access is included according to the contracted capacity.

Calculate your environment

Each device = 1 unit
Each contracted simultaneous session = 1 unit

On RDS or Terminal Server servers, each contracted simultaneous session equals one monitored unit.

10workstationsplus0RDS sessionsequals10monitored units

Temporary peaks do not interrupt collection. Capacity can be adjusted as the environment evolves.

Monitored capacity

10 units

Monthly estimate

R$ 249/month

R$ 149 with 5 included + 5 × R$ 20

Progressive terms

Your environment falls into the progressive terms range.

Enter at least 1 unit to see the estimate.

Talk to Usometria

Pricing and capacity

Frequently asked questions

What is a monitored unit?

One monitored computer or laptop equals one unit. On RDS/Terminal Server, each contracted simultaneous session equals one unit.

How does it work on RDS servers?

Capacity is defined by the number of contracted simultaneous sessions, not by the total number of registered users.

What happens if my environment temporarily exceeds the contracted capacity?

Collection is not interrupted. Usometria keeps recording the environment, and capacity can be reviewed when the growth becomes recurring.

Are dashboard users billed separately?

Management access is included according to the contracted capacity. There is no charge per monitored person.

Can I increase my capacity later?

Yes. The contracted capacity can follow the growth of the environment.

Is there a charge for the volume of data collected?

No. The model is based on monitored capacity, not on the number of events or recorded hours.

I have more than 25 units. How does it work?

Larger environments have progressive terms according to volume. Get in touch for sizing.

See what your resources are telling you.

Turn real usage into information for better decisions.

Prefer email? app@usometria.com.br